Structural resolution. The Patterson function and the Patterson method
Mode: full-screen / central-screen / help
Table of contents through the logo
To the table of contents

INTRODUCTION

Arthur L. PattersonThe impossibility of measuring the relative phases among the diffracted beamsΦ(hkl), makes unfeasible a direct calculation of the electron density function (Formula 1, below), which would provide us the atomic positions within the unit cell. This was remedied only after 1934 when Arthur Lindo Patterson (1902-1966) introduced his brilliant idea, thereby obtaining the first solution to the phase problem..., as he demonstrated in his article entitled A Fourier Series Method for the Determination of the Components of Interatomic Distances in Crystals, A.L. Patterson (1934) Phys. Rev., 46, 372-376. If you have no access to this article in Phys.Rev., you may get a photograph of its pages (except the last one), as provided by the University of Illinois.

Patterson derived his function, P(uvw), (Formula 2 below) by introducing
some modifications into the electron density function, so that the structure factors, represented by their amplitudes, [F(hkl)] and phases Φ(hkl), are replaced by the squared amplitudes whose values are proportional to the diffracted intensities (Formula 3 below). Therefore,  the Patterson function can be directly calculated from the experimental data obtained in the diffraction experiment. However, the issue is to obtain the atomic coordinates from this new function...


Formula 1. Electron density function


Formula 2. The Patterson Function


Formula 3. The relationship between structure factor amplitude and intensity. K is a scale factor, A is the absorption factor, L is the Lorentz factor, and p represents the polarization factor
 
The information provided by the maxima of the Patterson Function corresponds to a map of position vectors
(relative positions) between each pair of atoms in the structure. The value of the function at these maxima is proportional to the product of the implied atomic numbers, which provides a clear advantage for detecting vectors between "heavy" atoms, ie atoms with a large number of electrons.

If the crystal space (where the atoms are) is defined by the value of the
ρ function at every point in the unit cell given by the coordinates (x, y, z), the Patterson space (also periodic and defined by a unit cell identical to the crystal unit cell) is defined by the generic coordinates <u, v, w>, in such a way that any pair of atoms in the crystal, located at (x1, y1, z1) and (x2, y2, z2), will be shown in the Patterson map by a maximum with coordinates:

u = x1 - x2 ;  v= y1 - y2 ;   w = z1 - z2


Projection of the Patterson function derived from a crystal with three atoms. To obtain this function graphically from the known structure of a crystal (left figure) all interatomic vectors are plotted (central figure) and moved parallel to themselves to the origin of the unit cell of the Patterson space (right figure). The ends of these vectors correspond with the maximum values of the Patterson Function, whose heights are proportional to the product of the atomic numbers of the involved atoms. The positions of these maxima (with coordinates u, v, w) represent the differences between the coordinates of each pair of atoms in the crystal: u=x1-x2 , v=y1-y2 , w=z1-z2 . Note that at the origin (at the corners of the Patterson cell), there is a high maximum corresponding to the interatomic vectors of each atom with itself, that is with coordinates [0, 0, 0].


CHARACTERISTICS OF THE PATTERSON FUNCTION


The Patterson function displays the following characteristics:


  • The symmetry of the Patterson Function (the symmetry of Patterson space) is higher than the one of the electron density function (the crystal), so that if the crystal symmetry can be represented by one of the 230 space groups, the corresponding Patterson symmetry will be represented by only 24 space groups. This simplification is due to the loss of information that occurs when the structure factors (amplitudes and phases) in ρ(xyz) are replaced in the P(uvw) function by 
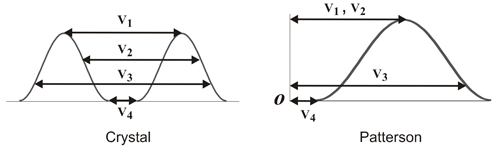
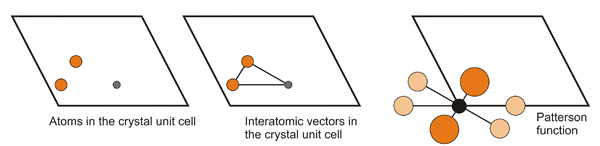
the squared amplitudes only. Moreover, the fact that since, for instance, there is a vector from atom 1 to atom 2, there will be another (identical but in the opposite direction) from atom 2 to atom 1. This means that the Patterson Function is always centrosymmetric (see figure above). Thus, any maximum of coordinates <u, v, w> will always have an equivalent one at <-u, -v, -w>. Therefore, the symmetry of the Patterson Function can easily be derived from the crystal symmetry by removing the translational part of every symmetry operator and adding a center of symmetry (if it did not exist previously). For example, if the symmetry operations of a crystal are those of the P21 space group, the symmetry operators of the corresponding Patterson Function will be:

         P21                     (x, y, z)   (-x, 1/2+y, -z)                    
Patterson   (x, y, z)  (-x, y, -z)  (-x, -y, -z)  (x, -y, z)


SOLVING THE PATTERSON FUNCTION. "HARKER-LINES" AND "HARKER-PLANES"


To solve a Patterson Function means to derive the atomic positions (coordinates) in the crystal (usually those of the atoms with more electrons) from the coordinates of the maxima of the Patterson map, and generally it is not easy. At least it was not so until 1935, when David Harker (1906-1991), a "trainee" at that time, discovered an "easy" way to solve the Patterson functions, a special circumstance that Arthur L. Patterson had not been aware of.

What Harker "saw" is that certain locations (lines or planes) in the Patterson Function contain information about the interatomic vectors between equivalent atoms (atoms related by symmetry operations), and therefore to locate an interatomic vector (between equivalent atoms) one has not to look around in the whole Patterson space, but just in these special locations.


For instance, any atom at coordinates 
(x, y, z) of a substance crystallizing in the space group Pm will always have another atom, equivalent to the former, at coordinates (x, -y, z) as a consequence of the mirror plane parallel to the a unit cell axis. And something similar will happen with crystal structures crystallizing in the space group P21 ... The coordinates of the interatomic vectors (in the Patterson map) for equivalent atoms in these two cases are shown in the table below:

Space group Equivalent atomic positions
in the crystal
Patterson vectors
(crystal coordinate differences)
Pm
(x, y, z)    ( x, -y,  z) <0, 2y, 0>          this a Harker line
P21 (x, y, z)    (-x, 1/2+y, -z) <2x, 1/2, 2z>     this is a Harker plane

This is shown graphically, for the space group 
Pm, in the picture below...


Vectors between "green" atoms in the crystal (left) appear in the Patterson function as vectors of the same color that can be drawn from any of the origins (corners of the Patterson map). And the same is true for vectors between the "orange" atoms. All these vectors, which relate atom pairs related by symmetry parallel to the a axis, have their locus in the Patterson as Harker lines with generic coordinates <0, 2y, 0>. The end of these vectors in the Patterson map appear as maxima represented as circles with those colors.


Finally, it might be useful for beginners to try to understand the following real example (doi:10.1107/S056774087800936X) that is summarized in the following paragraphs ...

The intention is to solve the 3-dimensional structure of an adduct of formula 
Zn(CN)2.DMP (DMP = Dimethyl-Phenanthroline). The compound crystallizes in the space group P21/c  and its unit cell is expected to contain 4 formula units. Its diffraction pattern has been obtained and the Patterson Function has been directly calculated using the diffracted intensities. The Patterson map shows the following most prominent peaks (coordinates expressed in terms of fraction of unit cell axes, that is as fractional coordinates):

  #   u v w Relative value of
the Patterson Function
1 0 0 0 999
2 0.50   0.50   0.45   342
3 0 0.05 0.50 337
4 0.51 0.45 0.95 137
5 0.26 0.92 0.14 129

The 4 equivalent positions in the space group 
P21/c, taken from the International Tables for X-ray Crystallography, are:

Symmetry operations of the space group P21/c
(x, y, z) (-x, 1/2+y, 1/2-z) (-x, -y, -z) (x, 1/2-y, 1/2+z)

This means that of the 4 equivalent Zn atoms located in the unit cell, we just have to locate one of them, the one located at (x, y, z). The remaining ones will be located at the positions given by the coordinates shown above.


The atomic numbers of the elements contained in the formula are:
 C: 6    N: 7    Zn: 30

We are asked to determine some atomic positions in the crystal which provide an initial distribution of phases to calculate an electron density map...


It seems obvious that, given the chemical composition of the crystal, the only "heavy" element is the Zn atom, so our goal will be to determine the position of this atom (the coordinates of one of them, since the remaining ones will automatically be located in the positions given by the symmetry operations).

The expected Harker peaks for the Zn atoms in the Patterson Function will be of the type given below as differences between the equivalent positions in the crystal, which are the differences between (x ,y, z) and its remaining equivalent positions:

Harker positions (-x, 1/2+y, 1/2-z) (-x, -y, -z) (x, 1/2-y, 1/2+z)
(x, y, z) <2x, -1/2, -1/2+2z> <2x, 2y, 2z> <0, -1/2+2y, -1/2>

These Patterson coordinates, written between <>, can always be transformed applying full cell translations in any direction as shown below:

Harker positions <2x, 1/2, 1/2+2z> <2x, 2y, 2z> <0, -1/2+2y, 1/2>

Actually the position of type
<2x, 2y, 2z> is not a Harker, because it does not correspond to any fixed position in the cell, but we maintain it in the table of interatomic vectors as it will be useful later on.

To interpret the maxima of this Patterson map (table above) we simply have to identify the experimental peaks with the corresponding expected Harker type. In this context, it seems obvious that the Harker peak of generic type <2x, 1/2, 2z-1/2> can be identified with the experimental peak #2. That is:

< 2x, 1/2, 2z-1/2 > = < 0.50 0.50 0.45 >; and therefore:    2x = 0.50;   2z-1/2 = 0.45 ;   x = 0.25   z =  0.47

If this is true, we can write as a first approach to the atomic coordinates of the Zn atom: Zn (0.25, y, 0.47).

To determine the third coordinate of the Zn atom (y) we will look into the remaining expected Harker positions, namely at 
<0, -1/2+2y, 1/2>, which could be identified with the experimental Patterson peak #3. That is:

< 0, 2y-1/2, 1/2 > = < 0, 0.05, 0.50 >; and therefore:       2y-1/2 = 0.05  ;  y = 0.27

Thus, if it is true, the position of the independent Zn atom in the structure will be:  Zn (0.25, 0.27, 0.47)

In order to check that this solution is true, we have to demonstrate that the third interatomic vector between Zn atoms, the one with generic coordinates
<2x, 2y, 2z> is also contained in the experimental Patterson map, that is, at <2x0.25, 2x0.27, 2x0.47> = <0.50, 0.54, 0.94>

A quick inspection of the table of peaks in the Patterson map (above) shows that this maxima
<0.50, 0.54, 0.94> does not exist, making the solution found for the Zn atom invalid?. However, we must not forget that the Patterson space also has its periodicity and symmetry, so before giving up, we should look into the equivalent positions of the Patterson map and try to apply the symmetry operators to this expected position, to look for some equivalent position of <0.50, 0.54, 0.94> appearing in the table of peaks.

To calculate the equivalent positions in the Patterson map, we will simply use what was stated above. The symmetry operations in the Patterson map can be derived from the ones in the crystal, eliminating their translational part, and adding a centre of symmetry (although in this case it was previously present):

 
Symmetry operations of the space group P21/c
(x, y, z) (-x, 1/2+y, 1/2-z) (-x, -y, -z) (x, 1/2-y, 1/2+z)
Symmetry of the corresponding Patterson map
(x, y, z) 
(-x, y, -z) (-x, -y, -z) (x, -y, z)

In fact, by applying the Patterson symmetry operator
( x, -y, z,)  to the expected peak <0.50, 0.54, 0.94>, we obtain < 0.50, 0.46, 0.94 >, which can be identified with peak #4. Therefore, the proposed coordinates for the Zn atom are true:   Zn (0.25, 0.27, 0.47).


But let's go back...
 
Table of contents